How AI Learned Whether You'll Complete Tomb Raider: Underworld
One of the first published examples of player analytics in AAA games.
AI and Games is made possible thanks to crowdfunding on Patreon as well as right here with paid subscriptions on Substack.
Support the show to have your name in video credits, contribute to future episode topics, watch content in early access and receive exclusive supporters-only content
If you'd like to work with us on your own games projects, please check out our consulting services provided at AI and Games. To sponsor our content, please visit our dedicated sponsorship page.
Note: This episode was originally written in 2018 and published on our old website.
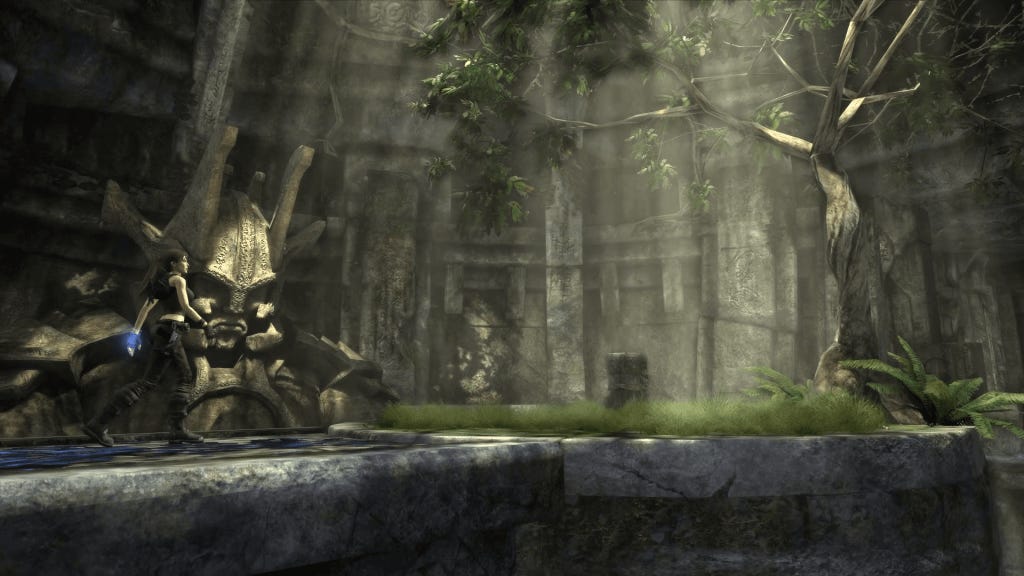
Tomb Raider: Underworld, the 2008 action adventure game by Crystal Dynamics is largely famous in academic research for a reason most players would never know. The story of one of the first major efforts at analysing player performance in a AAA video game — a feat achieved through large scale data collection and a little bit of help from artificial intelligence. All in an effort to answer the question: do players actually play the games we make in the way we expect them to?
Player Analytics: A Primer
Nowadays it’s incredibly common for games to adopt some form of analytics: a process whereby data is collected on how well the game performs as well as how players behave within it. This data can be used for a number of reasons, ranging from understanding the performance of the game, identifying issues within it, or more critically learning how players act within the game, which can lead to a number of interesting conclusions that studios can upon.
For example, live service games such as Fortnite are able to react to community behaviour: rolling out updates frequently to address gameplay balance based on player data. While this is also attainable from player feedback, often the data itself can give more meaningful insights into how players actually behave, versus how they say they do. Plus live-service games often have free-to-play monetisation models, and so they adopt this processes for the purposes of recognising levels of engagement in an effort to drive more revenue from their most active players, or encouraging new or lapsed players with a good deal on in-game items.
This isn’t the first time we’ve seen how large-scale data collection can be used to model aspects of player behaviour in games. To-date I’ve covered two academic projects, namely player performance analysis in Battlefield 3 as well as status analysis and the cosmetics economy in Team Fortress 2. Each of which highlighting how data about players can tell us interesting things that we perhaps wouldn’t expect. However it can also be used as part of core gameplay, a point I covered when exploring the ‘shadow AI’ in the reboot of Killer Instinct that replicates how a human plays to create an AI counterpart.
Player analytics has become increasingly commonplace with the surge of cloud computing and machine learning AI in recent years, but conducting this type of work even ten years ago was a bit of a hurdle. The technical infrastructure wasn’t in place and arguably the expertise in how to process and handle data at this scale wasn’t yet established.
As such, let’s take a look at how this work was achieved in Tomb Raider, how data was collected and processed and what they actually learned through this experiment.
About the Research
The research in question started back in 2008 and was intent on evaluating how audiences play a game once it has been released in the wild. While it’s commonplace for focus testing to be conducted during a games development, the work was intent on better understanding how target demographics play in their natural environment. This would help identify whether a game is meeting the expectations of both players and designers by looking at how it is performing ‘in the wild’ if you will.
While it may not seem obvious, even conducting this type of research in a game such as Tomb Raider is incredibly valuable. Even as the series has went through numerous reboots and interpretations, the core of Tomb Raider has largely remained consistent: Lara Croft needs to navigate a series of derelict, dangerous and often trap-ridden environments (typically tombs), fight off enemies and solve the odd puzzle here or there before finding and subsequently raiding the treasure vaults deep within. Despite this, each iteration of the franchise and their individual entries rebalances these elements in different ways and might not yield desired response from audiences, so it’s best to understand what is working (or not working) for players such they can capitalise upon that.
The project was kickstarted by game user researcher Alessandro Canossa. At the beginning of the project Canossa worked for Danish developer IO Interactive — the creators of Hitman — who were still at the time subsidiaries of Tomb Raider publisher Eidos Interactive (who were later named Square Enix Europe in 2009).
Through this company structure, Canossa and in-turn Crystal Dynamics — the acting developers of the Tomb Raider franchise — could utilise what is now known as the Square Enix Europe Metrics Suite. An event logging system utilised by a variety of developers under the publisher for recording data about how players are interacting with their games. For Tomb Raider, this included reporting when and where players die in the game and time taken to complete parts of each level. In an effort to get players data from their natural environment, the data used in all of the research in this video was acquired through Xbox Live around the fall of 2008 when the game launched. The SQE Metrics suite recorded data from around 1.5 million players, though not all of it proved useful for the research given it was broken, inaccurate or incomplete. However, tens of thousands of valid player instance data could be found within the database.
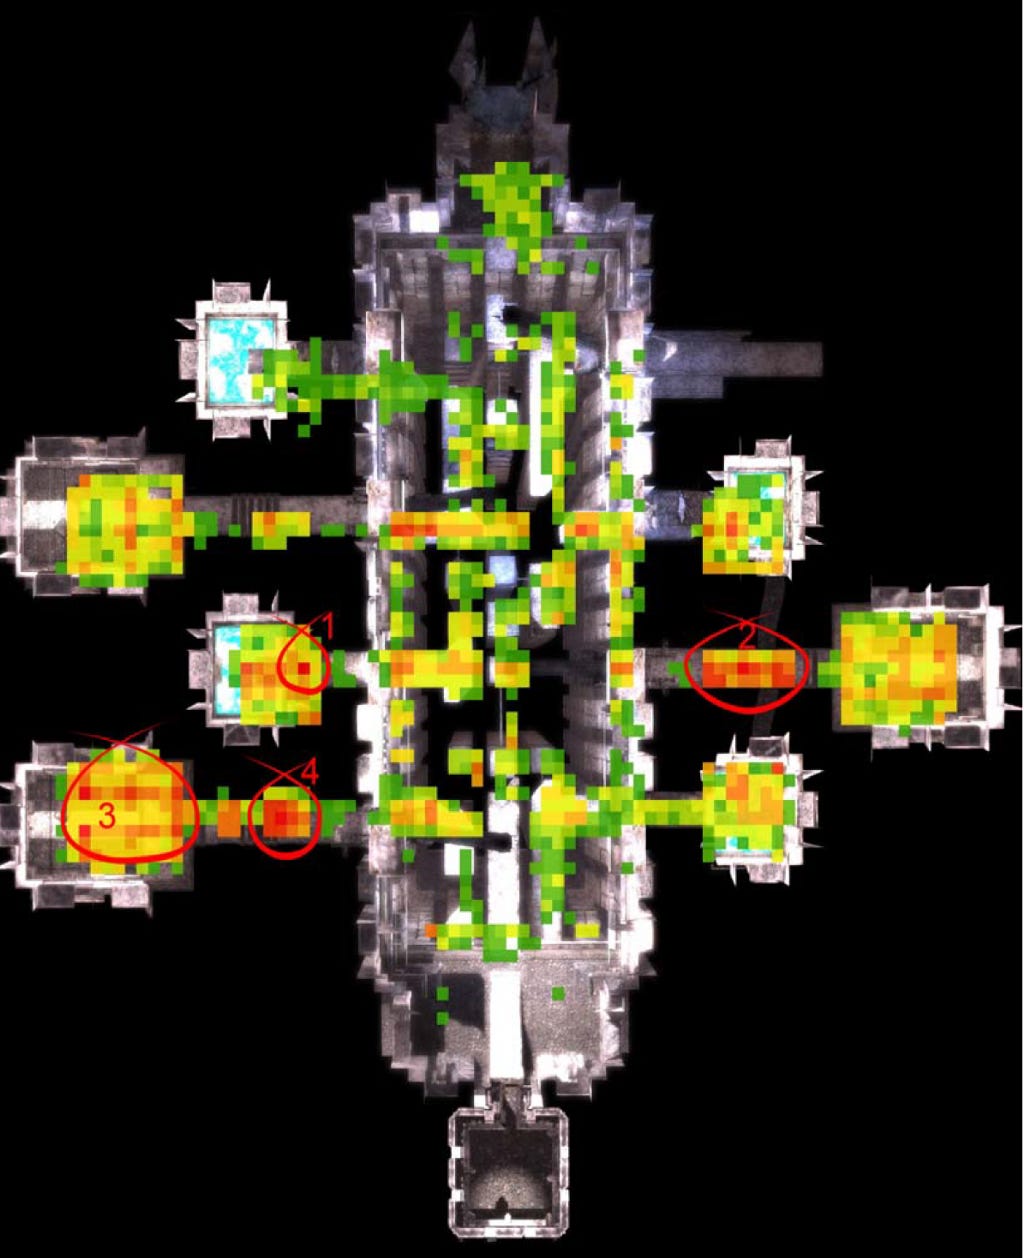
It was this point Canossa turned to researchers based at the IT University of Copenhagen, critically analytics researcher Anders Drachen, whose work appeared in my overview of AI research in StarCraft. There were some immediate avenues that this research could take, such as applying the data of around 28,000 players who had valid geospacial metrics (meaning the 3D coordinates of events logged matched against parts of the game map). These metrics could be assessed against the actual maps of the game to create visualisations of player death frequency, the variety of deaths occurring and how long players spent in specific parts of the map.
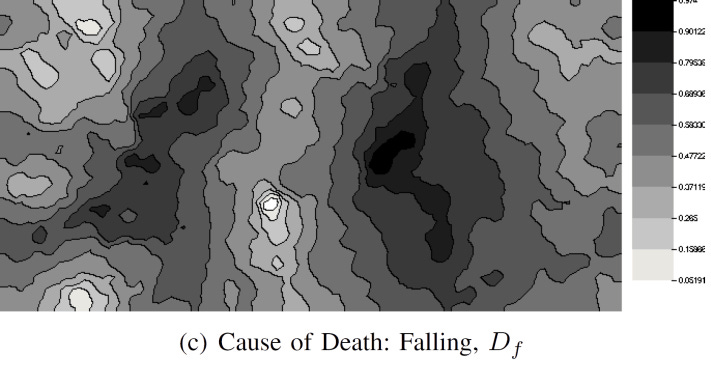
Utilising existing geographic information system technology, it allowed for visualisations such as this one of the Valaskialf map from the latter half of the game (Canossa & Drachen, 2009). This helped to identify which parts of the map were proving more challenging than others and isolate areas that may require tweaking.
Identifying Player Profiles
Canossa and Drachen alongside noted AI researcher Georgios Yannakakis — at the time also based at ITU — decided to explore something more ambitious as detailed in (Drachen et al., 2009). Could a machine learning algorithm train on this data in order to establish aspects of player behaviour? To do this, they gathered up data from just over 25000 players who played the Tomb Raider in November of 2008, but focused specifically on the 1365 players in their dataset that had completed the game in its entirety.
To run the experiment, the team extracted six major gameplay features from each player: the total number of deaths, the cause of each death, completion time and how frequently they used the Help on Demand feature: an option that allows for hints and solutions to puzzles to be presented for players. Whilst tangential to the study, it does raise some fun facts about this playerbase. For example, this set of 1300 players recorded over 520 days of playtime (averaging around 10 hours each) and died over 190,000 times. But it also identified the variety in player competence in the game: with the fastest completion time 2 hours 51 minutes and the most deaths recorded for any one player being 458. Interestingly, it highlighted that death by falling was the dominant issue for players — with 57% of all deaths recorded from falls, whilst just under 29% came from fighting NPCs and the remainder being environmental issues such as drowning, traps and fire.
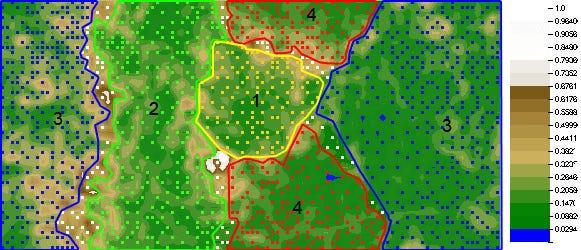
The team first utilised k-means and Wards hierarchical clustering to identify whether this large set of data could be reduced down to a smaller and more manageable space that identified trends of behaviour. This first identified around 3–5 clusters that could exist and as such a second analysis was conducted using a variant of neural networks known as an Emergent Self Organising Map (ESOM). The results behind this are pretty wild: the ESOM identified four major clusters of players that exist within the dataset: runners, solvers, veterans and pacifists. Each having a specific combination of traits in their data that told us something about how they play Tomb Raider.
First up, runners (group 4) have very fast completion times, with many of them having similar completion times to one another. Plus they die often with many instances coming from opponents and the environment. One area that is quite varied within this cluster is the use of the puzzle help feature: with some opting to use it a lot, and others hardly ever. Meanwhile, solvers (group 2) are the exact opposite: they seldom ever ask for hints to puzzles and solve puzzles quickly. However, they have very long completion times as well as few deaths by NPC or environment but they actually die a lot from falling. It suggests that solvers adopt a much slower, careful style when possible. As expected, pacifists (group 4) die mostly from opponents, but only have slightly below average completion times and minimal help requests. Lastly, veterans (group 1) appear to know what they are doing: they play through the game quickly (though typically not as fast as runners), but seldom die though still most deaths occur thanks to falls and environment.
With this body of work complete, it left an open question: what if using this data you could predict how a given player would behave in the future? How quickly can we establish that a player may adhere to one of these archetypes? Or perhaps a more useful piece of information about player engagement: are they going to stop playing because it’s too frustrating for them? Are they even going to finish the game and if so how long is it going to take them?
Predicting Player Behaviour
A follow up project by Tobias Mahlmann, alongside Drachen, Canossa, Yannakakis as well as Julian Togelius (detailed in Mahlmann et al, 2010) used the existing dataset but both expanded and contracted the set of data being considered. First of all, the number of players was increased to 10,000 (of which 6430 were usable), but the actual data from each player was no longer constrained by whether they actually completed the game. This resulted in three datasets: the first contained 2561 players that only completed the first level, the second containing 3517 players who beat both levels one and two and the final one — containing the 1732 players from the dataset who completed the entire game during December 2008 and January 2009.
In addition to extracting the playtime, total deaths (this time at a staggering 961,000), causes of death and use of the help-on-demand, the team also pulled features such as how many artefacts and treasures were collected, as well as settings being modified in the options menu. The game permits players to customise difficulty by tweaking ammo, enemy hit points, Lara’s health and use of saving grabs. Interestingly 15317 changes were made to customise the gameplay experience, but by only 1740 players in the dataset.
This time around, the team sought to build to train two predictor systems. The first to predict how many levels a player may complete and the second to estimate the total time it would take said player to complete the entire game. This was being based solely on data about their performances in level 1 (the Mediterranean Sea) and level 2 (Coastal Thailand). This was trained using the WEKA machine larning platform from the University of Waikato — which contains a variety of analytical and machine learning algorithms that are ideal for these purposes.
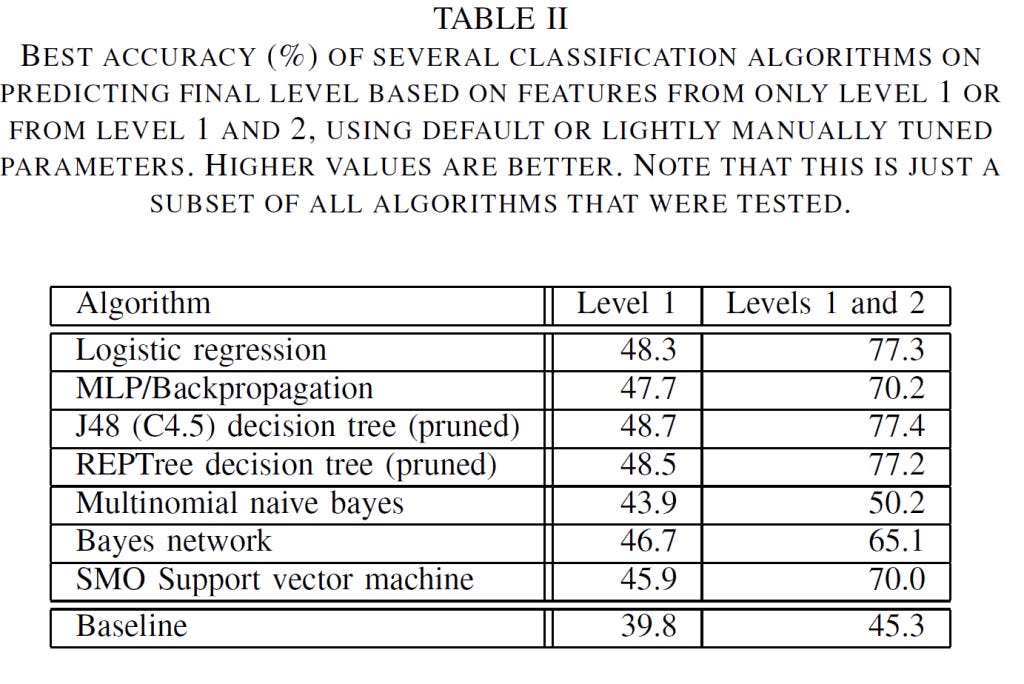
Whilst far from perfect, the results are fascinating. The results vary significantly, but numerous algorithms perform better than the predicated baseline that the authors estimated. However what was really interesting, was analysis conducted by the authors on the REPTree algorithm that they tested against. This algorithm could predict the final level with 48.5% accuracy using just level 1 data, but it only used one rule: how long the player spends in the opening area of the sea at the start of the Mediterranean mission. This could achieve almost 50% accuracy based based solely on who long you spent floating around at the beginning. In addition, when expanding the dataset to levels one and two, it’s accuracy improved to 76.7%, but it only considered one location from level 2 as well as the total rewards collected for level 2. It suggests that the amount time players spend in given areas and how well they perform within them is sufficient to determine how well a player will continue through the game and whether they even finish it. Further analysis of this phenomena, helped established that of 55 features recorded in the first two levels, four in particular were deemed most significant — the time spent on the seatop in level 1 and in the Norsehall in level 2 alongside the amount of help required and rewards gathered in level 2.
Despite this, the resulting output for predicting time didn’t yield any major improvements, with the relative absolute error still being significantly high.
Do Player Behaviours Change Over Time?
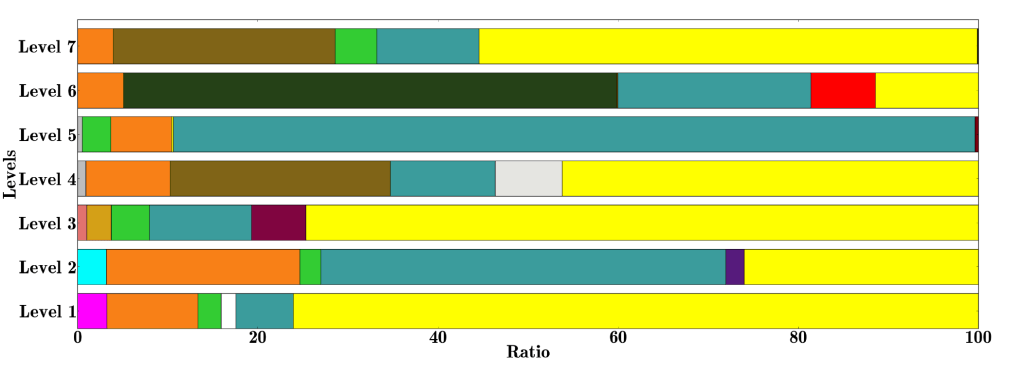
Lastly, a final body of work published in 2013 whilst Canossa and Drachen were both based at Northeastern University in Boston (detailed in Sifa et al. 2013). Having assessed what types of groups exist within the data and what features help identify players within them, this final experiment sought to assess whether these groups evolve or change during the game. Using the same set of features as the second experiment, this project explored data from 62,000 players who completed at least a significant portion of the game from a collection of 203,000 from the same existing set gathered between December 2008 and January 2009 (equating to around 4.2% of all gathered player data during the launch window). This time using a form of archetypal analysis, the researchers analysed two particular aspects of the data. First, how players that completed the game (which was around 16% of the 62,000) spent their time in levels and second analysing how the features being recorded for each player changed as they progressed between levels. This resulted in six archetypes being established from this data: with players migrating between archetypes during their playtime. While each archetype shows a gradual increase in completion time — given the levels are getting harder — they vary in the actual time taken, showing variation in player skill.
In addition, each level shows a different distribution of player clusters: highlighting how some become more prominent than others in specific levels of the game. Meanwhile others only exist in certain levels. When cross referenced against the original player clustering work, they found four recurring clusters that showed strong similarities to the veterans, pacifists and solvers.
Veterans in matched up with Adrenalin-Reward (light-green): a cluster of players that complete the game fast, make few adjustments and heavily use the adrenalin feature in the game.
Death-Reward-Environment (a less consistent cluster that is captured by the dark orange and platinum and black segments) matched up with Pacifists due to an ability to collect a lot of artefacts and dying from environmental causes.
Time-reward in yellow shows strong similarities to the solver profile, where players generally perform well, but are very slow to complete the game and collect a lot of rewards in each map. Suggestion they explore the world a lot more and seek out treasures and other goodies.
Closing
While Tomb Raider Underworld is largely forgotten in the ongoing adventures of Lara Croft, the impact this game had on the emerging game analytics field (and AI research as well) is hard to ignore. In much of the contemporary research literature on game analytics, Tomb Raider: Underworld is celebrated as one of the seminal bodies of work that established what we can learn from even the smallest amounts of data and paved the way for more exciting projects in the future — some of which I already covered here on the channel. It’s fair to say game analytics are only going to increase in scope moving forward, so who knows, maybe we’ll find out in a couple of years whether players fare better in the more recent entries of the franchise.
References
Drachen, A., & Canossa, A. (2009). Analyzing spatial user behavior in computer games using geographic information systems. In Proceedings of the 13th international MindTrek conference: Everyday life in the ubiquitous era (pp. 182–189). ACM.
Drachen, A., Canossa, A., & Yannakakis, G. N. (2009). Player modeling using self-organization in Tomb Raider: Underworld. In Computational Intelligence and Games, 2009. CIG 2009. IEEE Symposium on (pp. 1–8). IEEE.
Mahlmann, T., Drachen, A., Togelius, J., Canossa, A., & Yannakakis, G. N. (2010). Predicting player behavior in Tomb Raider: Underworld. In Computational Intelligence and Games (CIG), 2010 IEEE Symposium on (pp. 178–185). IEEE.
Sifa, R., Drachen, A., Bauckhage, C., Thurau, C., & Canossa, A. (2013). Behavior evolution in Tomb Raider: Underworld. In Computational Intelligence in Games (CIG), 2013 IEEE Conference on (pp. 1–8). IEEE.


